One of the cool features that differentiate Mixtable from traditional Excel workbooks is that Mixtable tracks changes for each cell. When a cell’s content is changed by either a Mixtable user, or by new data syncing from Shopify, the changes in a cell’s history are recorded and can be accessed by you. As your product information evolves, this allows you to see granular changes for each field of a product over time, and who made the change. There are two ways to access product history in Mixtable:
Viewing a Row’s History will allow you to see the changes to all cells in the given row over time. This feature allows you to see the edit history of your product for the fields that you’ve mapped into your worksheet, all in one place.
Once you install and open the Mixtable workbook (spreadsheet), you can add a new Worksheet that is integrated with your Shopify product data.
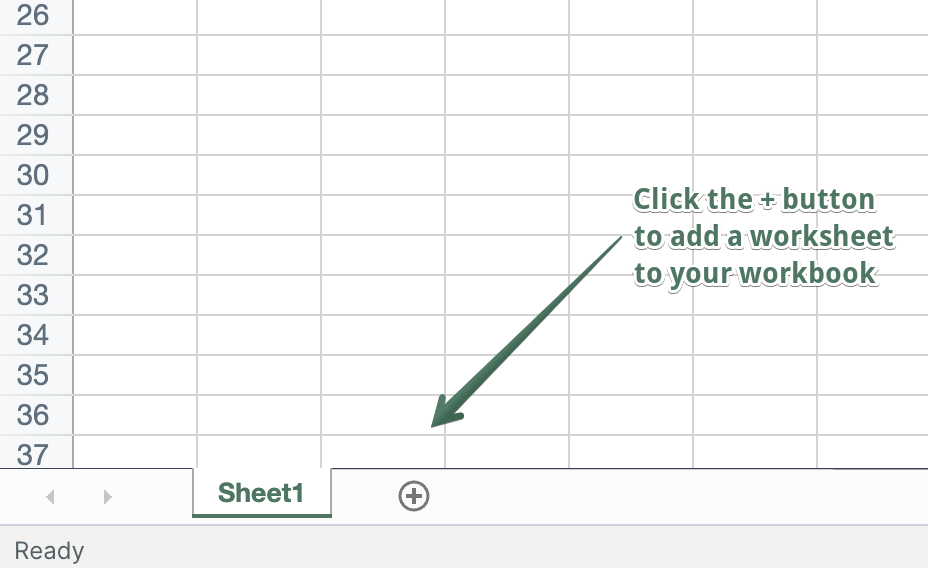
In an existing Mixtable workbook, click the (+) button to add a new worksheet.

Find the row in your products’ worksheet that holds the data for the product whose history you’d like to see. Right-click on the row header and select the View Row History menu option. A visual panel will open on the right of your screen, showing you all the changes to the row’s cells over time.
Viewing a Cell’s History will allow you to see the changes to a cell over time. So, to view the changes to a particular field for a particular product, find the cell that displays the relevant data.
To access a cell’s history, simply right-click on the cell and select the View Cell History menu option. A visual panel will open on the right of your screen, showing you all the changes to the cell over time.
In the example below we are able to see how the tags for a specific product have changed.
You can see how to check Shopify Product price history here.
You're ready!
Mixtable is an online spreadsheet designed to sync data with Shopify. It looks, feels, and behaves like Excel (including formulas), but runs in your browser. With Mixtable you can:
Best of all, you can sync changes back to Shopify with a single click. Find out more about the Mixtable suite of products here.