 Analytics & Reports
Mixtable is an online spreadsheet, designed from the ground up to bulk edit and analyze Shopify data.
Got a question? We're here to help! Reach out at [email protected], and we'll get back
to you promptly.
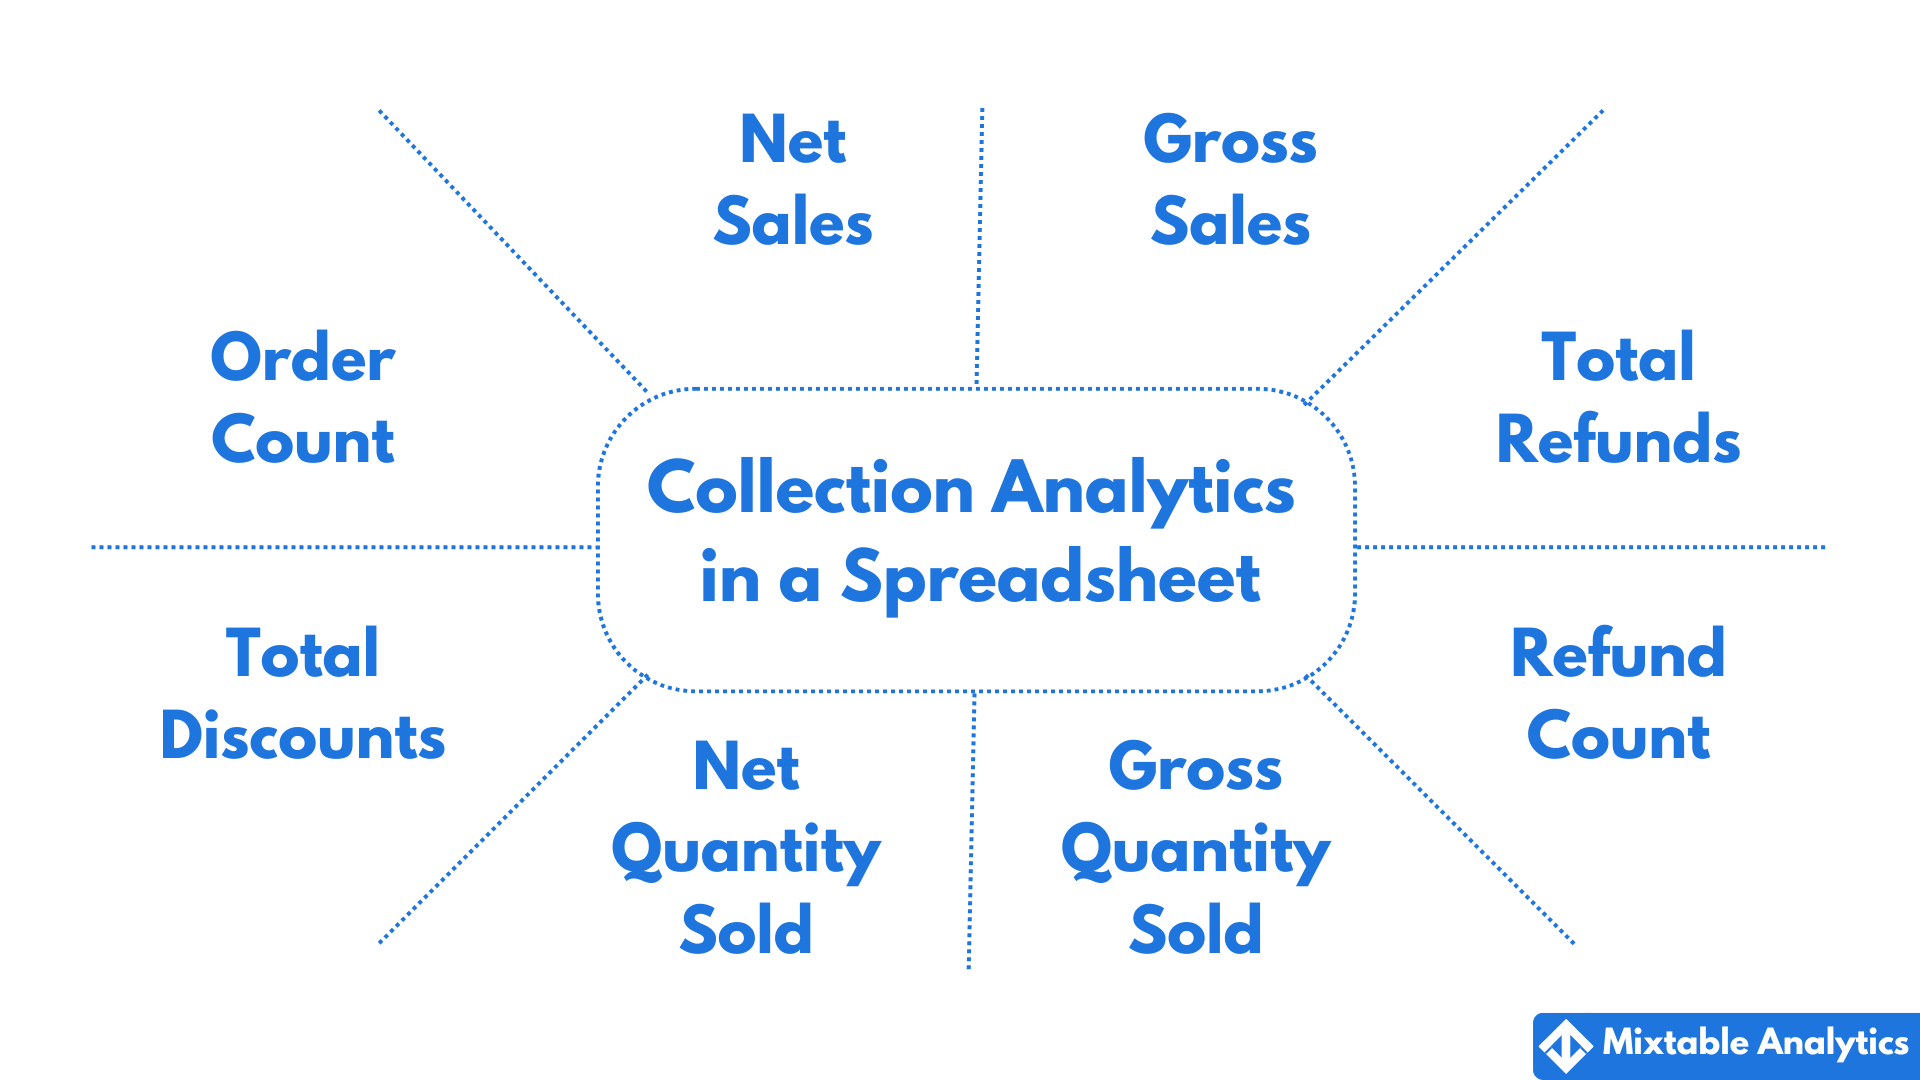
Grouping products into collections in Shopify allows for easier product browsing and discovery. Analyzing the performance of collections would provide you with a high-level view of your store. With Collection Analytics by Mixtable, you can see net and gross sales, quantity sold, refunds, and discounts - all this from the convenience of an online spreadsheet.
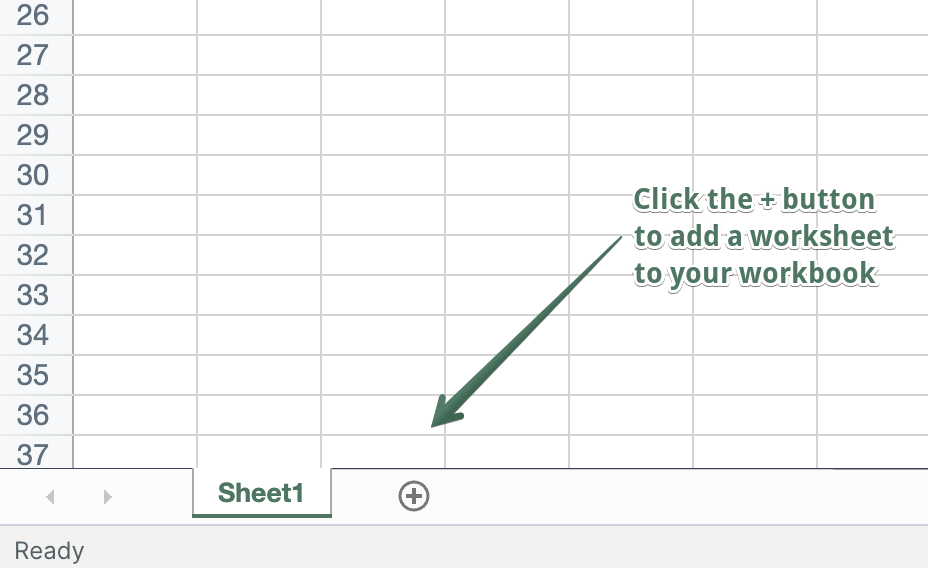
If you have already created a Mixtable workbook for your Shopify store, you can quickly add a new Collections worksheet. Here is how to do it:
In an existing Mixtable workbook, click the (+) button to add a new worksheet.
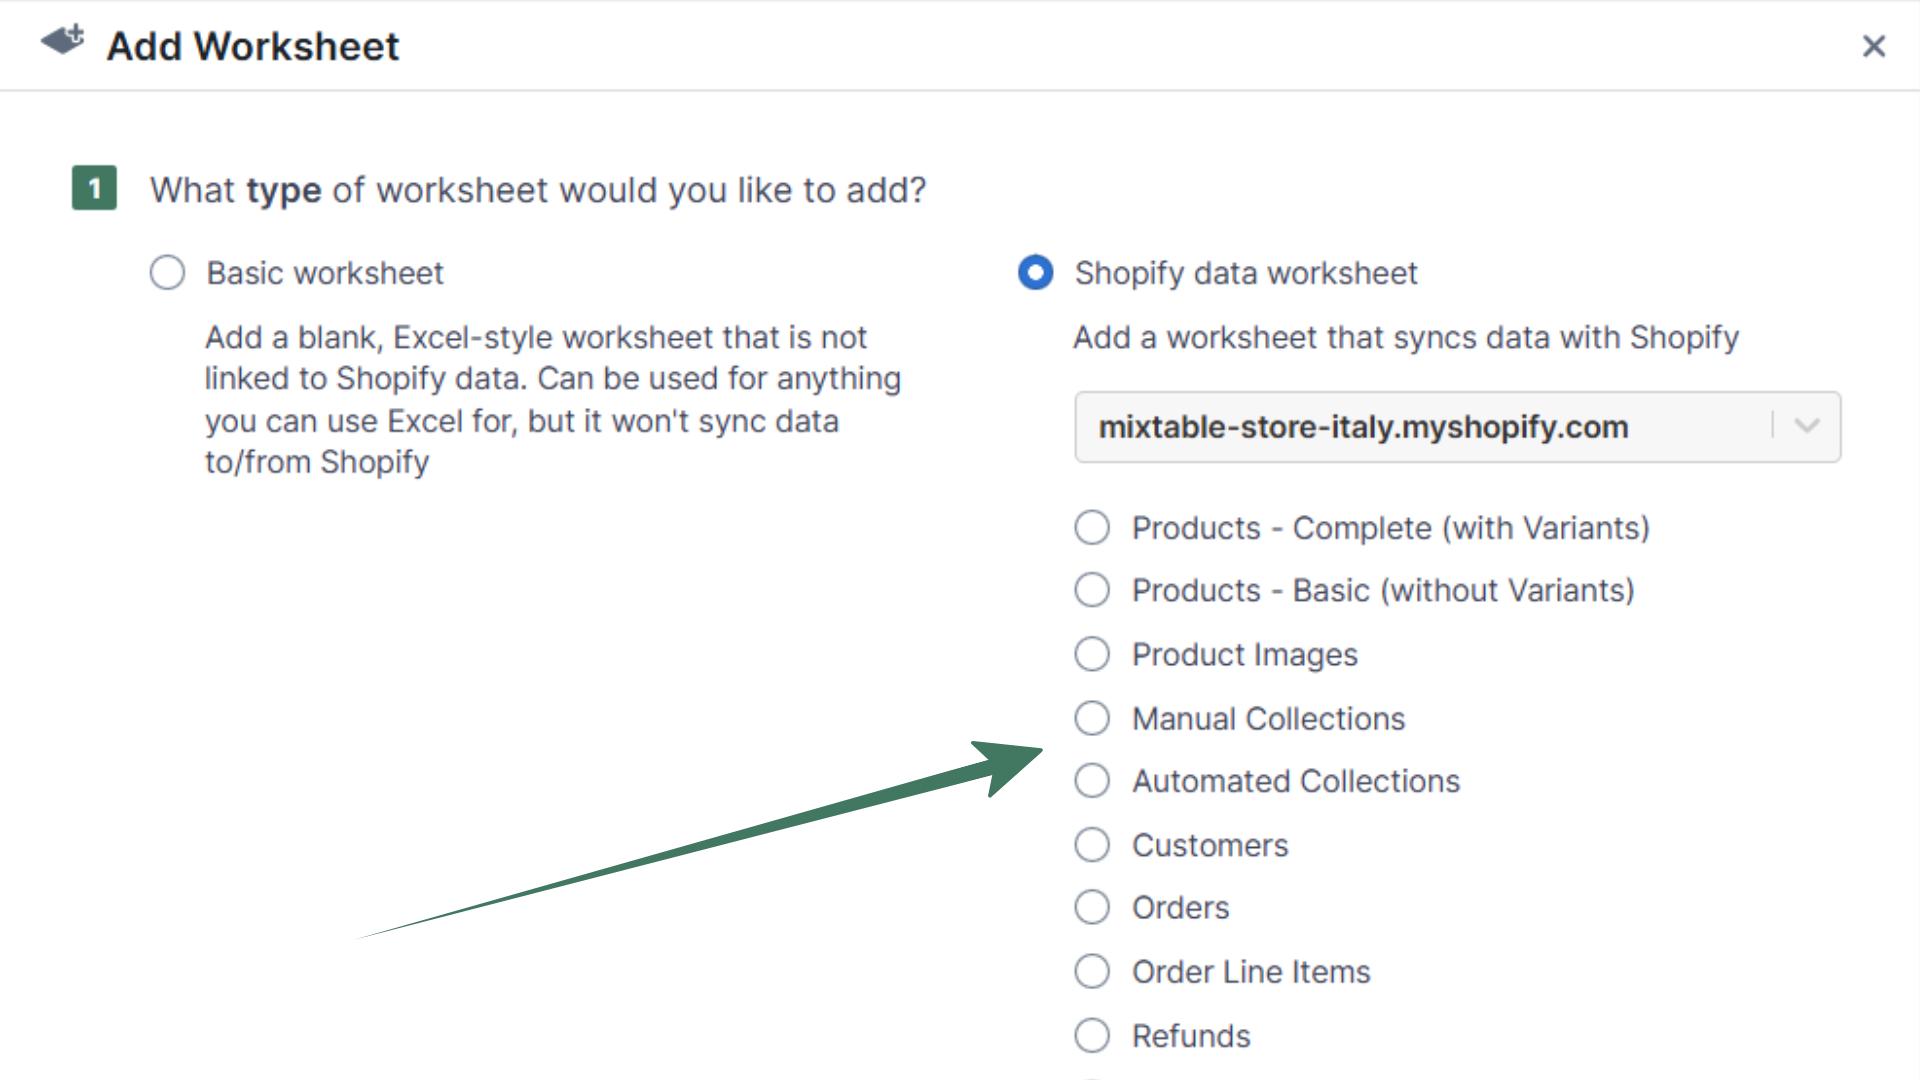
From the Add Worksheet window, choose Shopify data worksheet > Collections.
Here’s how to map Net Sales or Gross Sales per collection into your Mixtable Collection worksheet.
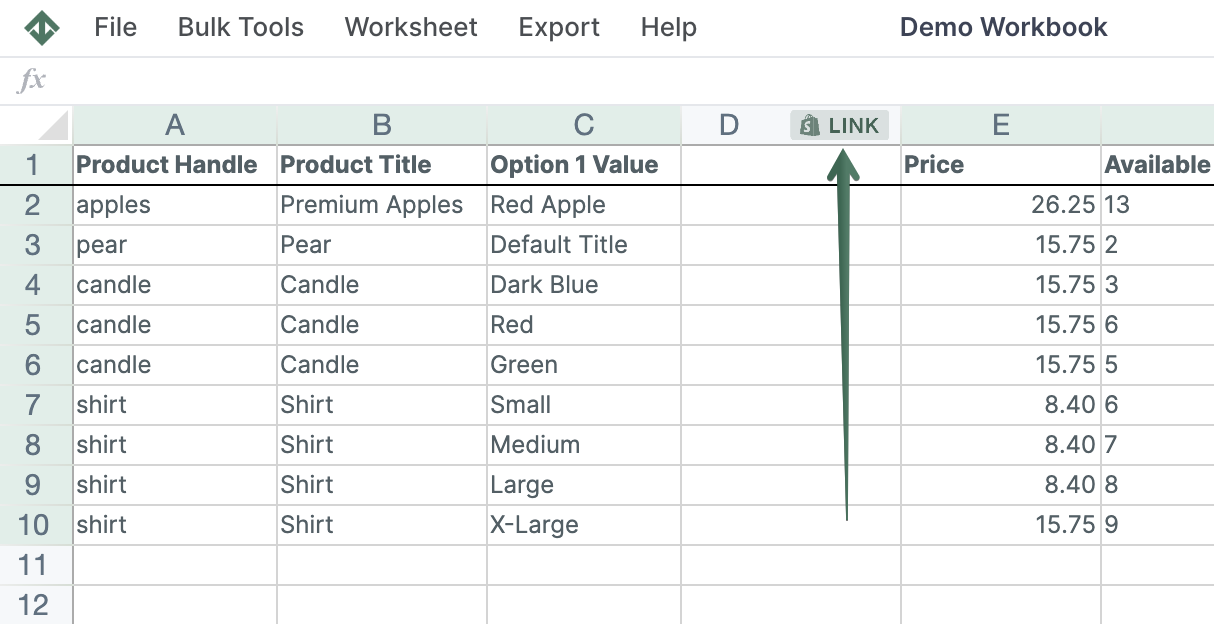
To load new Shopify data, start by selecting an empty column — any column with a non-green header (green headers mean the column is already linked to Shopify data). Then, click the ⚡️ button in the column header to open the selection window to choose the data you want to pull in.
From the Shopify Sync Settings window, choose Analytics
Then, select the Net Sales or Gross Sales metric
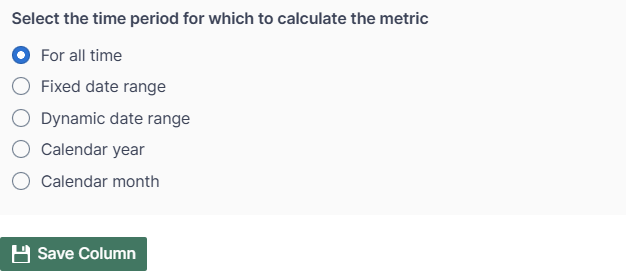
Select the time range that you want the {{object2}} to be calculated for
Here’s how to map Net Quantity Sold or Gross Quantity Sold per collection into your Mixtable Collection worksheet.
To load new Shopify data, start by selecting an empty column — any column with a non-green header (green headers mean the column is already linked to Shopify data). Then, click the ⚡️ button in the column header to open the selection window to choose the data you want to pull in.
From the Shopify Sync Settings window, choose Analytics
Then, select the Net Quantity Sold or Gross Quantity Sold metric
Select the time range that you want the {{object2}} to be calculated for
Here’s how to map Orders Count per collection into your Mixtable Collection worksheet.
To load new Shopify data, start by selecting an empty column — any column with a non-green header (green headers mean the column is already linked to Shopify data). Then, click the ⚡️ button in the column header to open the selection window to choose the data you want to pull in.
From the Shopify Sync Settings window, choose Analytics
Then, select the Orders Count metric
Select the time range that you want the {{object2}} to be calculated for
Here’s how to map Total Refund Amount per collection into your Mixtable Collection worksheet.
To load new Shopify data, start by selecting an empty column — any column with a non-green header (green headers mean the column is already linked to Shopify data). Then, click the ⚡️ button in the column header to open the selection window to choose the data you want to pull in.
From the Shopify Sync Settings window, choose Analytics
Then, select the Total Refund Amount metric
Select the time range that you want the {{object2}} to be calculated for
Here’s how to map Refund Count per collection into your Mixtable Collection worksheet.
To load new Shopify data, start by selecting an empty column — any column with a non-green header (green headers mean the column is already linked to Shopify data). Then, click the ⚡️ button in the column header to open the selection window to choose the data you want to pull in.
From the Shopify Sync Settings window, choose Analytics
Then, select the Refund Count metric
Select the time range that you want the {{object2}} to be calculated for
Here’s how to map Total Discount Amount per collection into your Mixtable Collection worksheet.
To load new Shopify data, start by selecting an empty column — any column with a non-green header (green headers mean the column is already linked to Shopify data). Then, click the ⚡️ button in the column header to open the selection window to choose the data you want to pull in.
From the Shopify Sync Settings window, choose Analytics
Then, select the Total Discount Amount metric
Select the time range that you want the {{object2}} to be calculated for
Here’s how to map Percent of Orders Refunded per collection into your Mixtable Collection worksheet.
To load new Shopify data, start by selecting an empty column — any column with a non-green header (green headers mean the column is already linked to Shopify data). Then, click the ⚡️ button in the column header to open the selection window to choose the data you want to pull in.
From the Shopify Sync Settings window, choose Analytics
Then, select the Percent of Orders Refunded metric
Select the time range that you want the {{object2}} to be calculated for
Mixtable Analytics allows you to filter the collection data based on the customer segments you have created in Shopify.
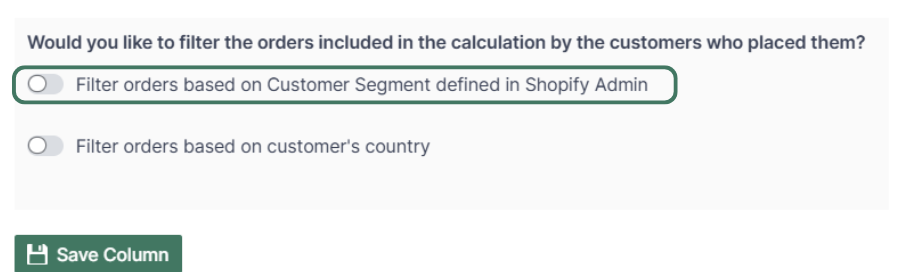
Note: The customer segments shown are the ones you have defined in your Shopify Admin. To add or change your segments, please use the Shopify Admin, and Mixtable will reflect your changes automatically.
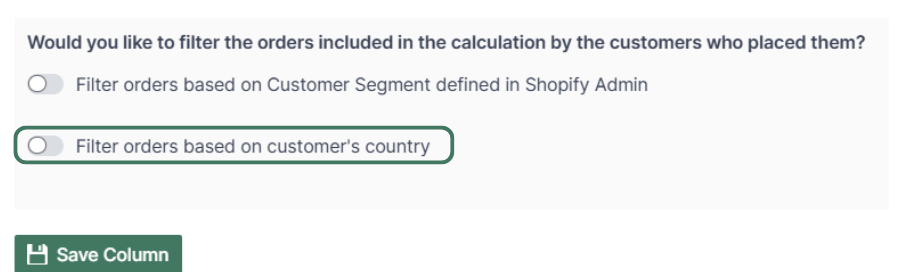
Another option for filtering collection data is according to the customer’s country. Use this feature to calculate your international store performance.
You are ready!
Well done! Now that you have collection data data in an online spreadsheet, you can use any Excel function to analyze the data, such as:
Find out more about the Mixtable suite of products here.