Shopify Customer Analytics
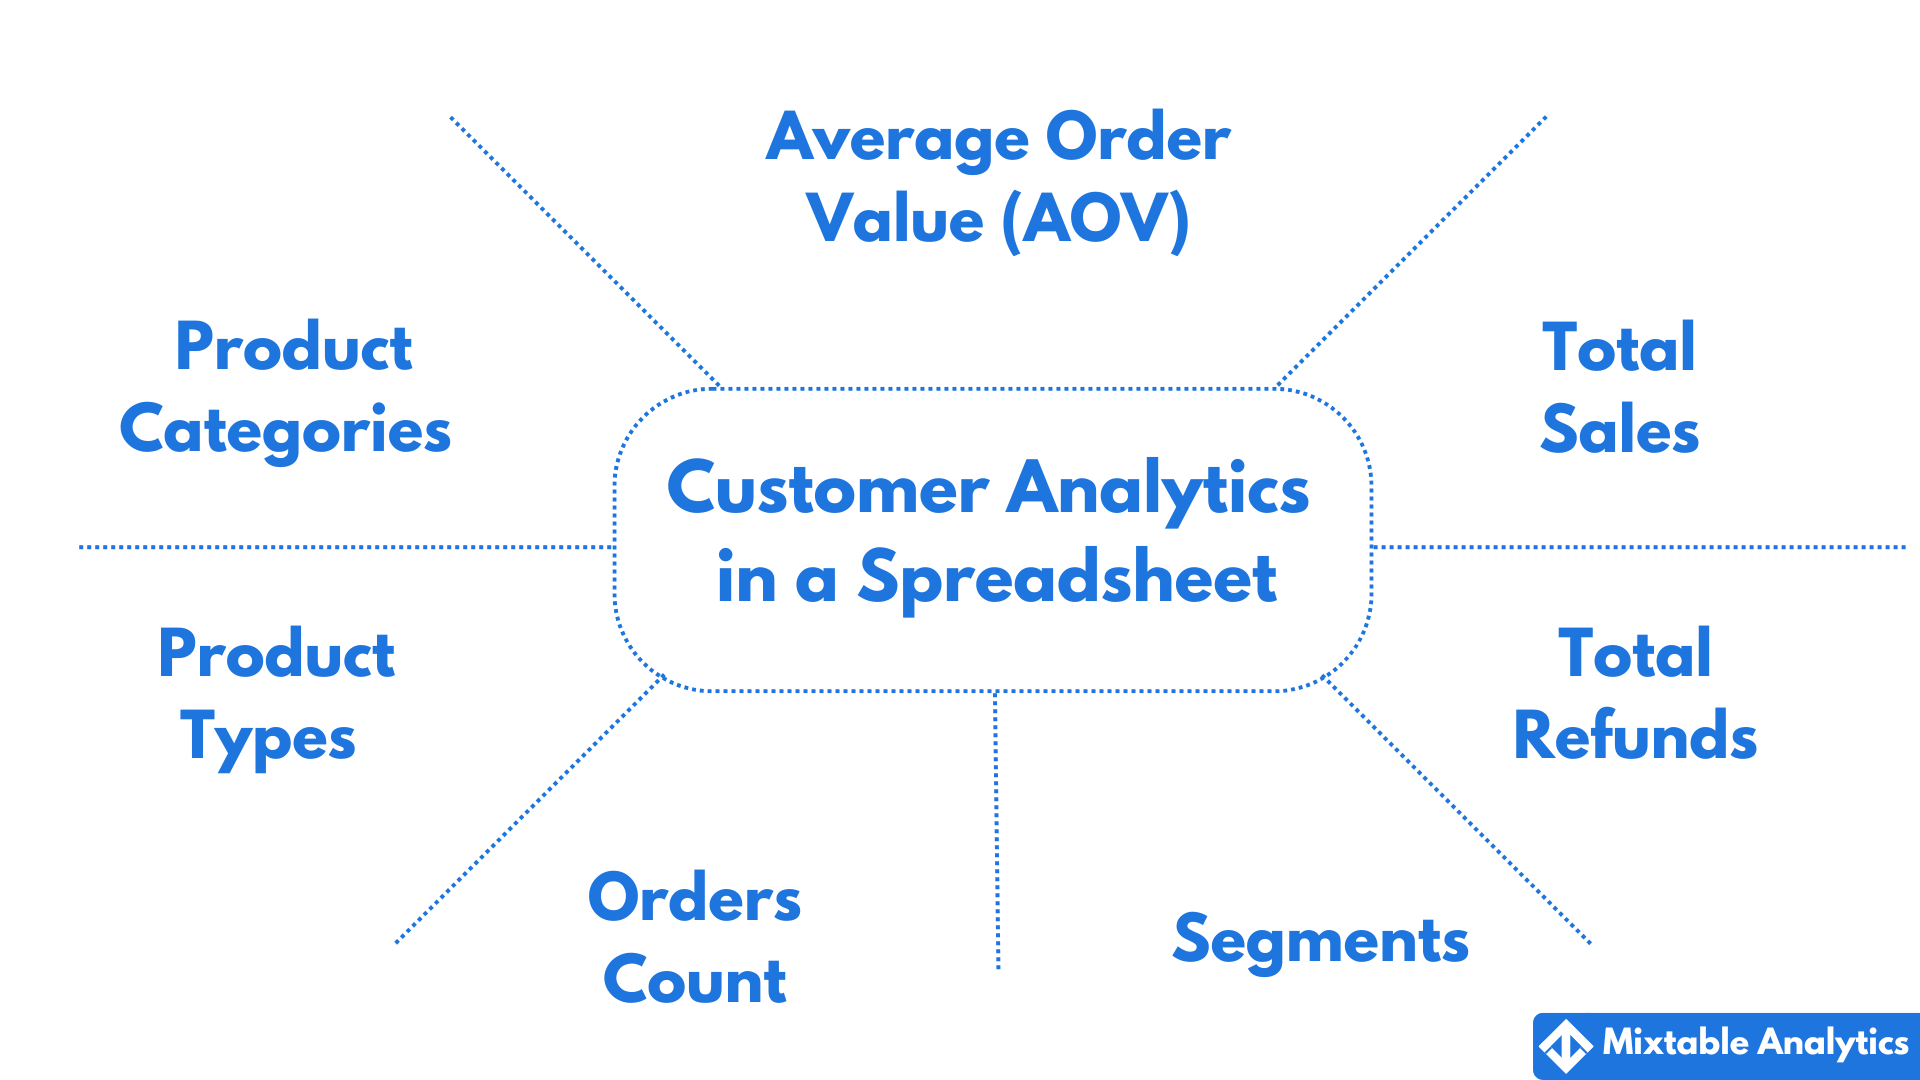
Shopify Customer Analytics empowers you to better understand and engage your customers through comprehensive data. From average order values to total sales, refunds, and purchase trends, Mixtable offers detailed insights into customer behavior, helping you easily make data-driven decisions.
With Mixtable Analytics, you can seamlessly access this valuable customer data in an online spreadsheet, enabling you to:
- Segment customers for targeted campaigns.
- Deliver personalized experiences and offers.
- Optimize marketing strategies and beyond.
This guide walks you through integrating Shopify Customer Analytics into your Mixtable spreadsheet, enabling you to unlock key metrics like Average Order Value (AOV), Total Sales, and Product Categories Bought. Follow the steps below to start leveraging these insights to grow your business.
How to add Shopify Customer analytics to a spreadsheet
-
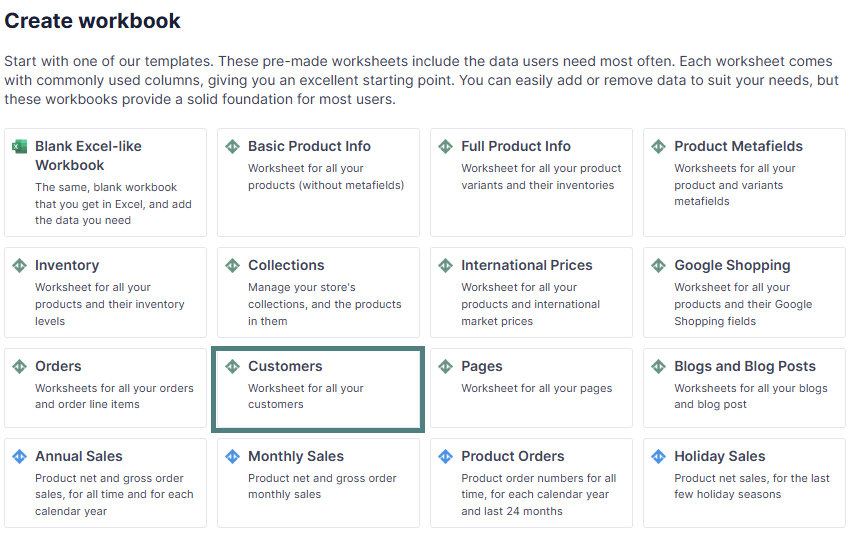
After installing the Mixtable Analytics app, click the Create a Workbook button
-
From the list of ready templates, select Customers. This template will load the following data from your store:
- Names, email, and Shopify IDs per customer
- Total orders
- Product tags
- Shopify Forms submissions
Average Order Value (AOV) analytics per customer
AOV per customer is calculated by dividing the total sales generated by this customer by the number of orders (orders count) they have generated.
Here’s how to map AOV data into your Mixtable Customer Analytics spreadsheet:
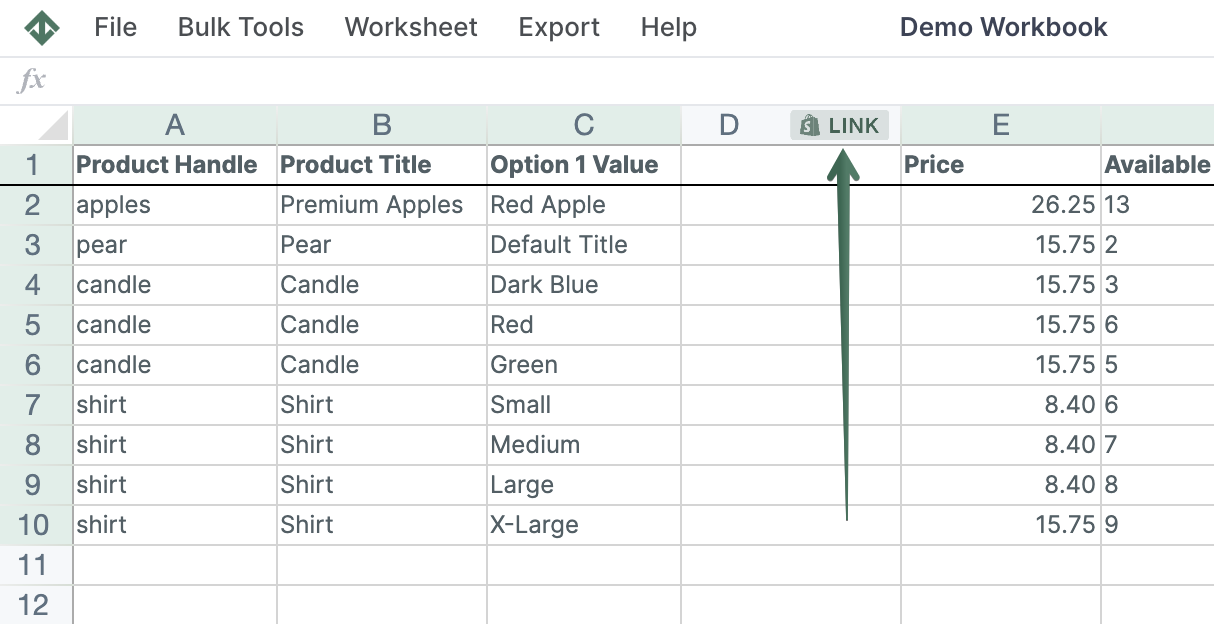
- In your Customers worksheet, select an empty column (or insert a new one). Then click Link from the column header.
-
From the Shopify Sync Settings window, choose Analytics
-
Then, select the Average Order Value metric from the drop-down list.
-
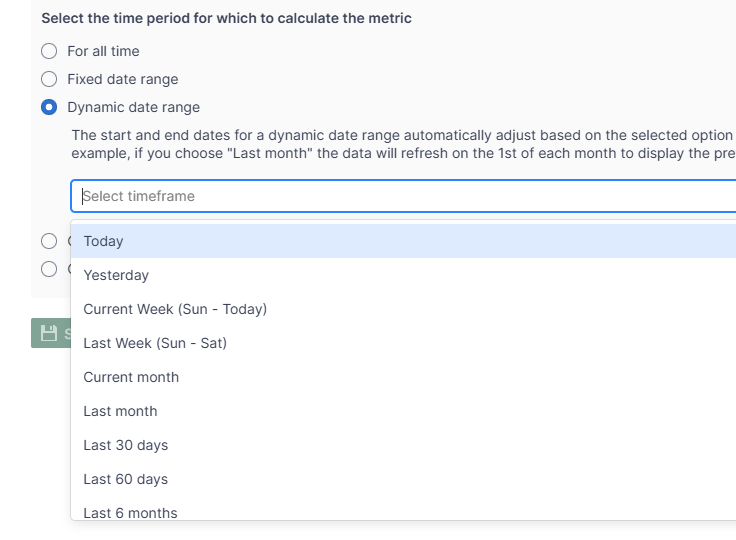
Select the time range that you want the Average Order Value to be calculated for
- For all time - all data since the creation of the store
- Fixed date range - show data for a specific period between two dates
- Dynamic date range - calculate the Average Order Value for a dynamic time period in the past, e.g., last 7 days, last 30 days. If you select this option, the data will be recalculated daily as the date range window moves forward.
- Calendar year and month - show the AOV for a specific year (e.g., 2024) or a specific month (e.g., May 2024).
- Now, you can see AOV per customer in your Shopify spreadsheet.
Total Sales per customer analytics
Here’s how to map Total Sales per customer data into your Mixtable Customer Analytics spreadsheet:
- In your Customers worksheet, select an empty column (or insert a new one). Then click Link from the column header.
-
From the Shopify Sync Settings window, choose Analytics
-
Then, select the Total Sales metric from the drop-down list.
-
Select the time range that you want the Total Sales to be calculated for
- For all time - all data since the creation of the store
- Fixed date range - show data for a specific period between two dates
- Dynamic date range - calculate the Total Sales for a dynamic time period in the past, e.g., last 7 days, last 30 days. If you select this option, the data will be recalculated daily as the date range window moves forward.
- Calendar year and month - show the Total Sales for a specific year (e.g., 2024) or a specific month (e.g., May 2024).
-
Now, you can see Total Sales per customer in your Shopify spreadsheet.
Total Refunds per Customer
Here’s how to map Total Refunds per customer data into your Mixtable Customer Analytics spreadsheet:
- In your Customers worksheet, select an empty column (or insert a new one). Then click Link from the column header.
-
From the Shopify Sync Settings window, choose Analytics
-
Then, select the Total Refunds metric from the drop-down list.
-
Select the time range that you want the Total Refunds to be calculated for
- For all time - all data since the creation of the store
- Fixed date range - show data for a specific period between two dates
- Dynamic date range - calculate the Total Refunds for a dynamic time period in the past, e.g., last 7 days, last 30 days. If you select this option, the data will be recalculated daily as the date range window moves forward.
- Calendar year and month - show the Total Refunds for a specific year (e.g., 2024) or a specific month (e.g., May 2024).
-
Now, you can see Total Refunds per customer in your Shopify spreadsheet.
Product Categories Bought analytics per customer
Product Categories Bought lists all the categories of products from which a particular customer has bought a product (if there are more than one, categories are divided by commas). Here’s how to map Product Categories Bought per customer data into your Mixtable Customer Analytics spreadsheet:
- In your Customers worksheet, select an empty column (or insert a new one). Then click Link from the column header.
-
From the Shopify Sync Settings window, choose Analytics
-
Then, select the Product Categories Bought metric from the drop-down list.
-
Select the time range that you want the Product Categories Bought to be calculated for
- For all time - all data since the creation of the store
- Fixed date range - show data for a specific period between two dates
- Dynamic date range - calculate the Product Categories Bought for a dynamic time period in the past, e.g., last 7 days, last 30 days. If you select this option, the data will be recalculated daily as the date range window moves forward.
- Calendar year and month - show the Product Categories Bought for a specific year (e.g., 2023) or a specific month (e.g., July 2024).
-
Now, you can see Product Categories Bought per customer in your Shopify spreadsheet.
Product Types Bought per customer
If you sell several types of unrelated products on your store, this analytics metric will help you analyze your customers’ behavior and group them into specific segments.
Here’s how to map Product Types Bought per customer data into your Mixtable Customer Analytics spreadsheet:
- In your Customers worksheet, select an empty column (or insert a new one). Then click Link from the column header.
-
From the Shopify Sync Settings window, choose Analytics
-
Then, select the Product Types Bought metric from the drop-down list.
-
Select the time range that you want the Product Types Bought to be calculated for
- For all time - all data since the creation of the store
- Fixed date range - show data for a specific period between two dates
- Dynamic date range - calculate the Product Types Bought for a dynamic time period in the past, e.g., last 7 days, last 30 days. If you select this option, the data will be recalculated daily as the date range window moves forward.
- Calendar year and month - show the Product Types Bought for a specific year (e.g., 2022) or a specific month (e.g., September 2023).
-
Now, you can see Product Types Bought per customer in your Shopify spreadsheet.
Orders Count analytics per customer
Here’s how to map Orders Count per customer data into your Mixtable Customer Analytics spreadsheet:
- In your Customers worksheet, select an empty column (or insert a new one). Then click Link from the column header.
-
From the Shopify Sync Settings window, choose Analytics
-
Then, select the Orders Count metric from the drop-down list.
-
Select the time range that you want the Orders Count to be calculated for
- For all time - all data since the creation of the store
- Fixed date range - show data for a specific period between two dates
- Dynamic date range - calculate the Orders Count for a dynamic time period in the past, e.g., last 7 days, last 30 days. If you select this option, the data will be recalculated daily as the date range window moves forward.
- Calendar year and month - show the Orders Count for a specific year (e.g., 2024) or a specific month (e.g., March 2024).
-
Now, you can see Orders Count per customer in your Shopify spreadsheet.
”Segments Customer Is In” analytics
Here’s how to map Segments Customer Is In data into your Mixtable Customer Analytics spreadsheet:
- In your Customers worksheet, select an empty column (or insert a new one). Then click Link from the column header.
- From the Shopify Sync Settings window, choose Analytics
- Then, select the Segments Customer Is In metric from the drop-down list.
- Now, you can see the Segments Customer Is In in your Shopify spreadsheet.
Data comparison
-
You can use the same Link option to add multiple columns to the worksheet and map the analytics data you need.
-
With Mixtable you can use spreadsheet functions to operate with the data, such as: