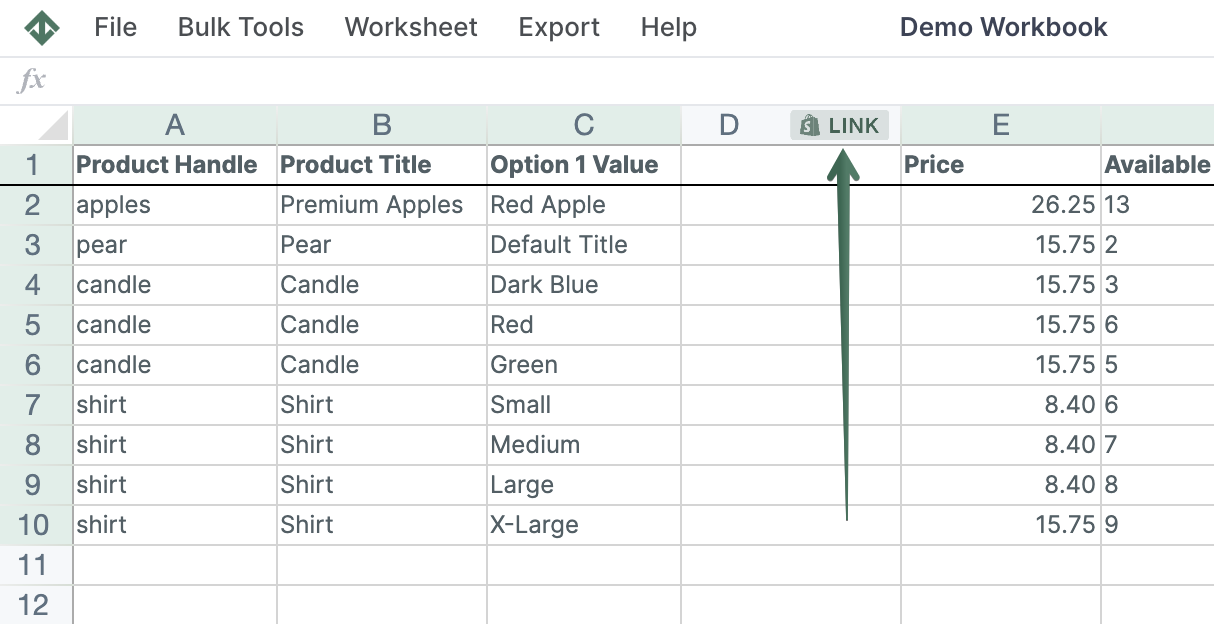
Mixtable is an online spreadsheet, designed from the ground up to bulk edit and analyze Shopify data.
Got a question? We're here to help! Reach out at [email protected], and we'll get back
to you promptly.
Grouping customers with similar characteristics into customer segments is a great way to manage your store, create targeted campaigns, and analyze your results. You can define your customer segments in the Shopify admin or use the default customer segment templates that Shopify provides you with. Then, with Mixtable Analytics you can track the performance of the segments, further optimize them, and learn more about your customers.
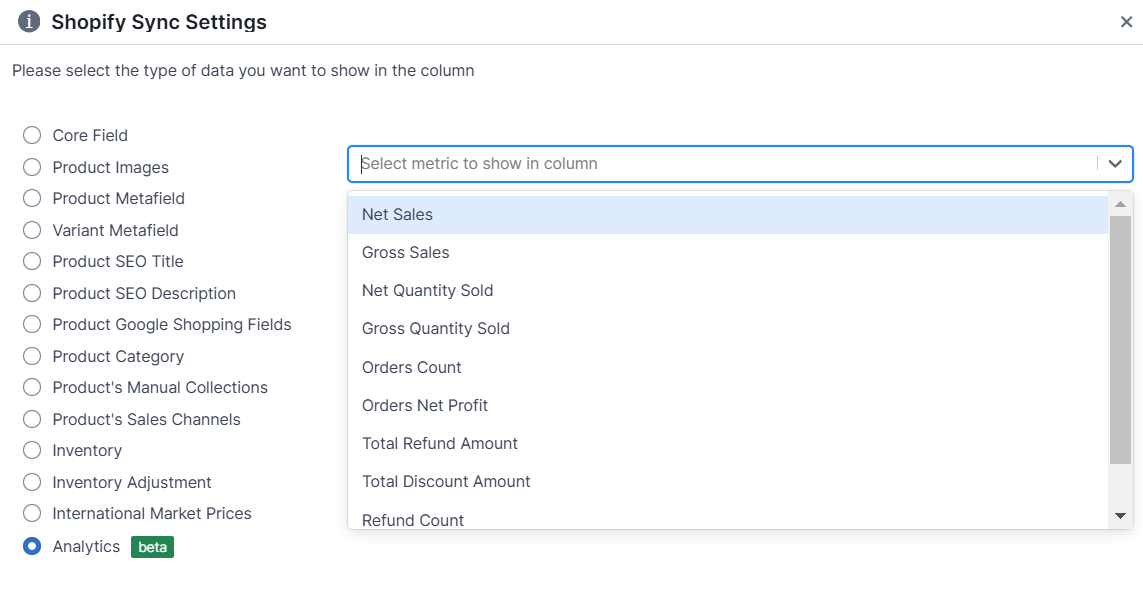
If you have already created a Mixtable workbook for your Shopify store, you can quickly add analytics data to an existing worksheet, filtered for the customer segment you want to analyze. The analytical metrics this can be done for include:
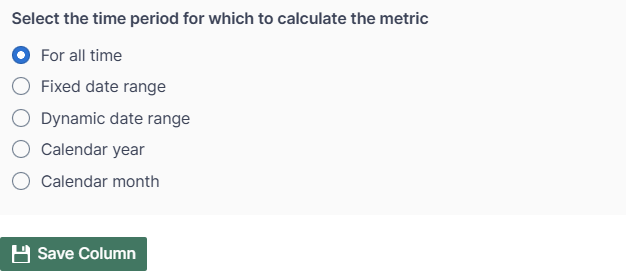
Select the time range that you want the data to be calculated for
Use the Filter orders based on Customer Segment defined in Shopify Admin option to select the segment from the dropdown for which to show the metric. If you set this the data shown in the column will only be for the customer segment you select. For example, if you choose Net Sales for calendar year 2024, and add a Customer Segment filter, then only orders bought by a customer in the specified filter will be used to calculate the net sales for 2024.
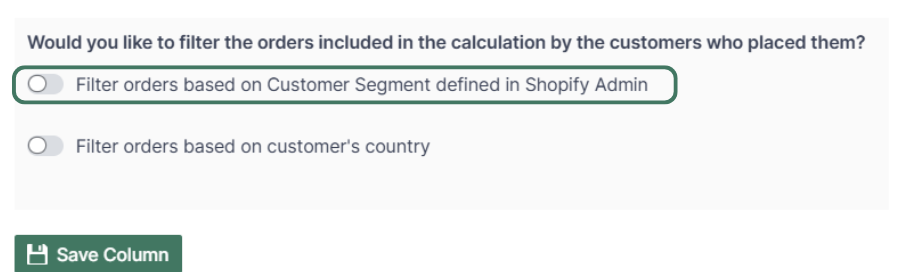
Note: The customer segments shown in the dropdown are the ones you have defined in your Shopify admin. To add or change your segments please use the Shopify Admin, and Mixtable will reflect your changes automatically.
Use the same Link option to add multiple columns. You can:
map sales from different segments,
or add analytics data by customer segment for:
With Mixtable you can use spreadsheet functions to operate with the data, such as:
Find out more about the Mixtable suite of products here.