Mixtable is an online spreadsheet, designed from the ground up to bulk edit and analyze Shopify data.
Got a question? We're here to help! Reach out at [email protected], and we'll get back
to you promptly.
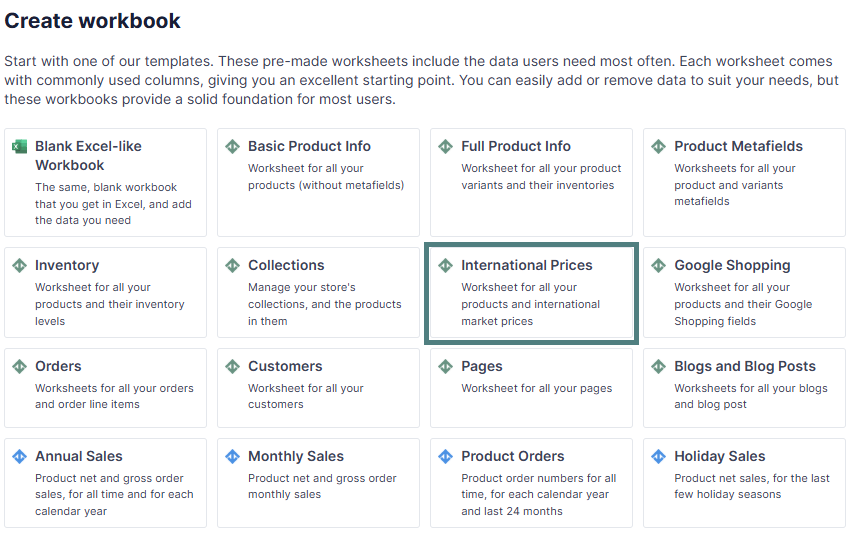
Would you like to have a 10k-foot view of your international price strategy and how it performs? With the Mixtable International Prices template, you will be able to see all your international prices in one place and, on top of that, be able to set, edit, or remove the “Compare at” price for any international market you operate on (something you currently can’t do from the Shopify admin). The best part is that you can do all this in bulk and from the convenience of a spreadsheet!
With the International Prices template, you can:
See all international market prices in one place and update them in bulk: View all your market prices side by side in a single spreadsheet. Quickly adjust fixed prices as needed and sync them back to Shopify.
Compare Price Variations: The spreadsheet view of the prices and discount rates on all markets provides a full picture of your price strategy:
Set “Compare At” prices for different markets in Shopify in bulk.
Check Discount Patterns: You can see and compare the discounts you offer across all markets and answer questions like:
In addition, you also get market-specific insights:
Note: Make sure you use the currency abbreviation before the price.
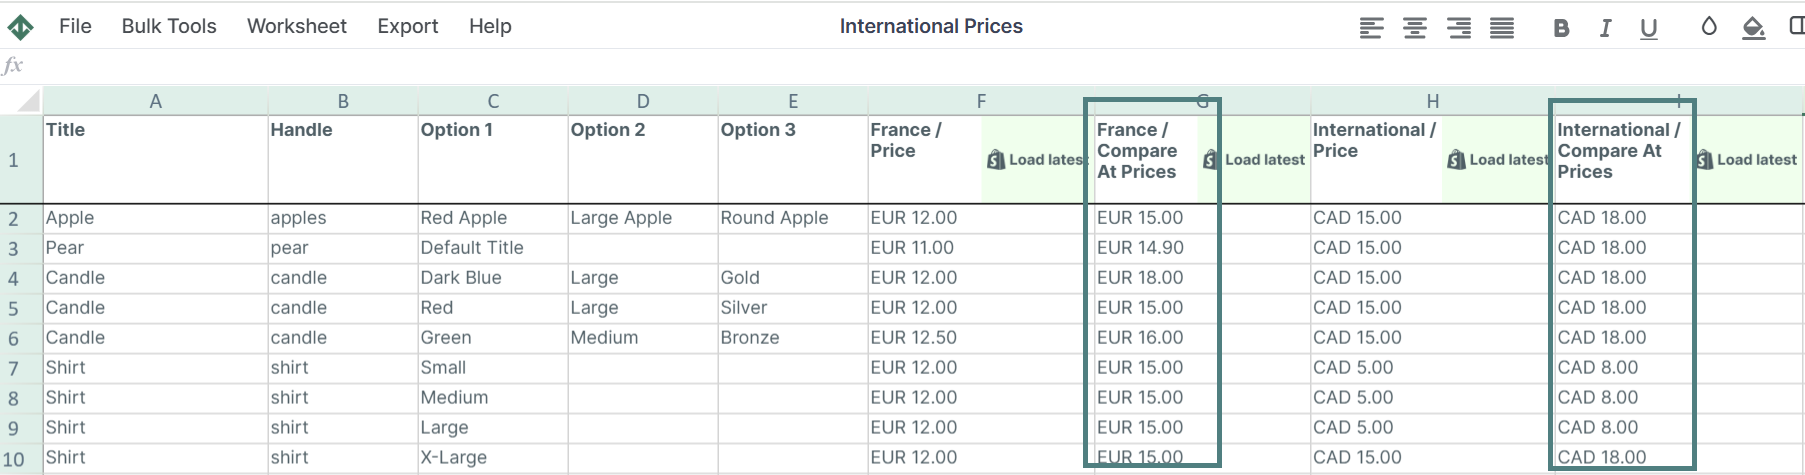
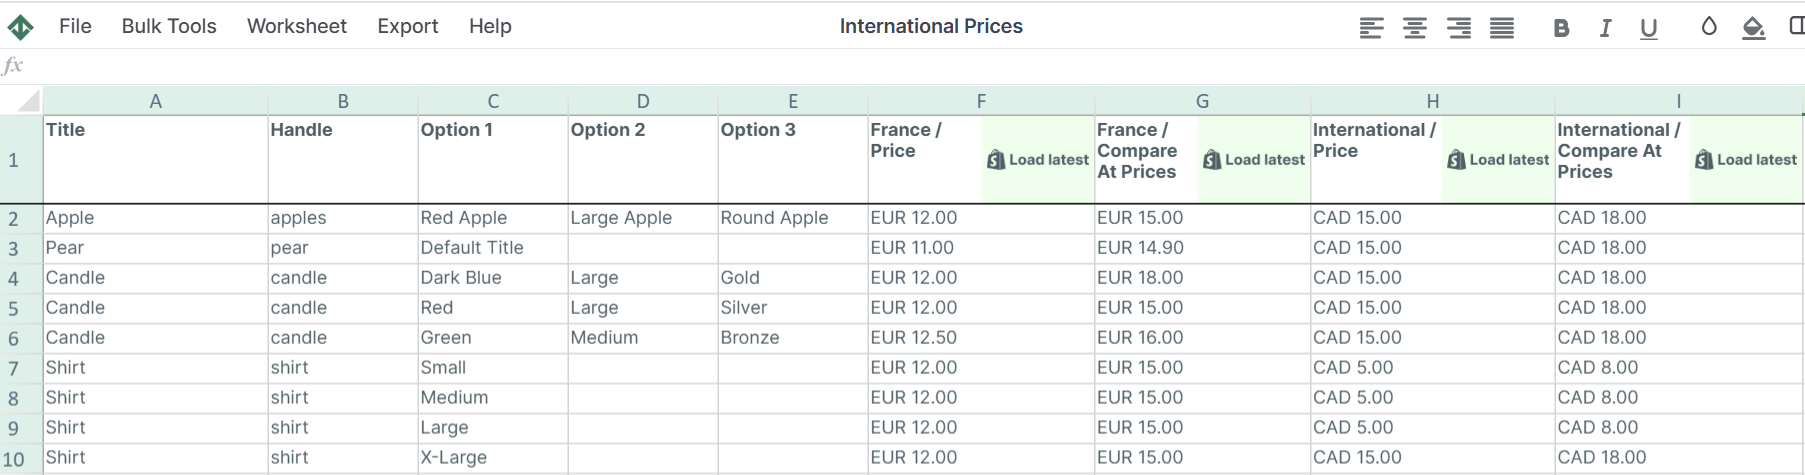
The International Prices template contains the following default columns:
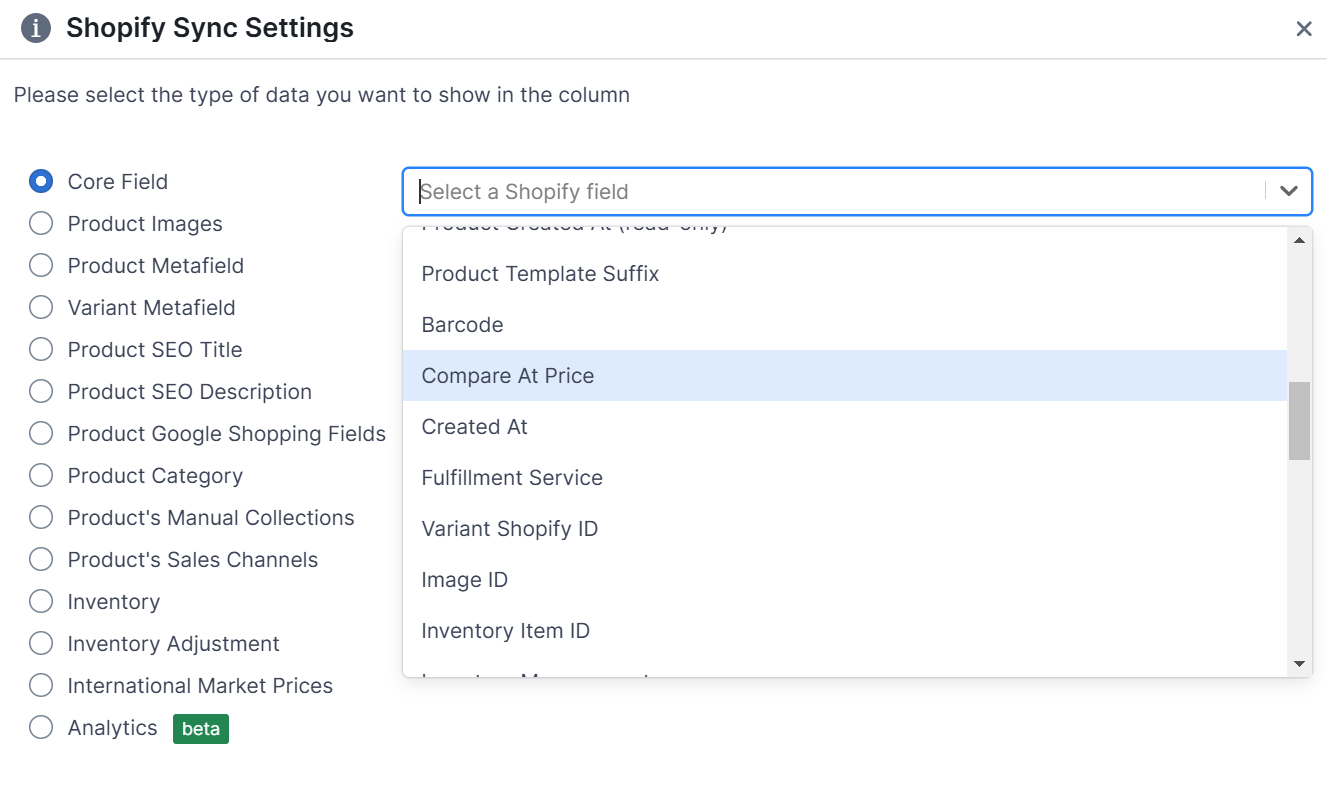
In addition to the default data pulled from the International Prices template, you can map extra columns with data, such as:
Here’s how:
Here is how you can add your main market Price and Compare At price to the International Price template:
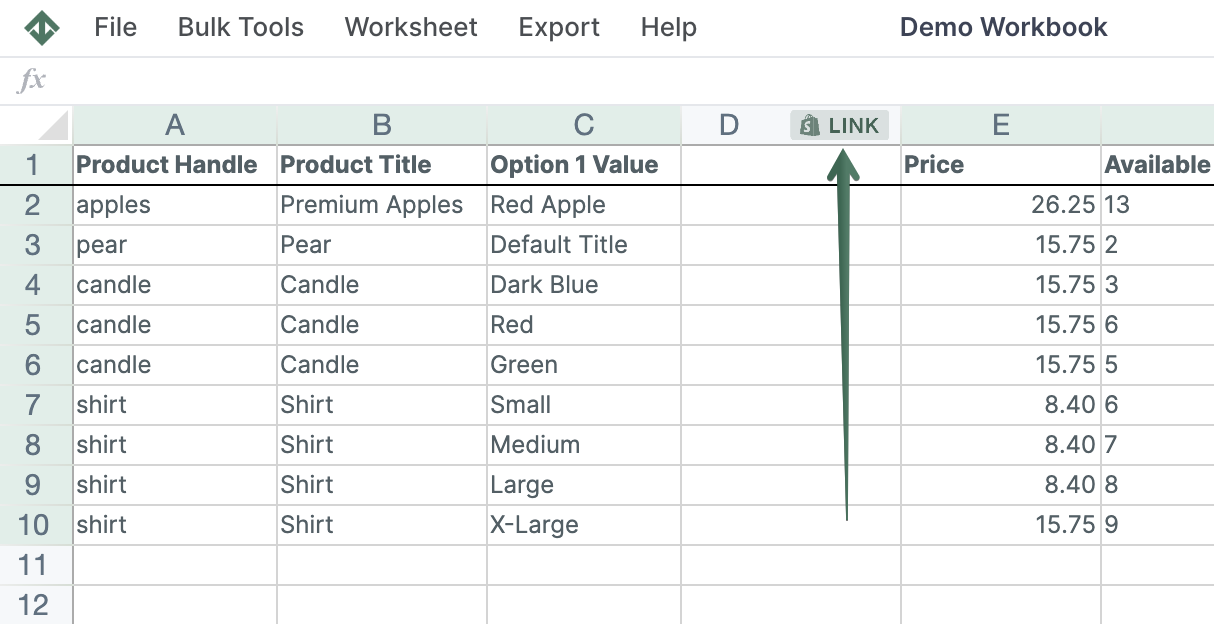
Well done! Now, you can compare international prices next to default prices. Similarly, you can add any additional Shopify data you need to improve your analysis and decisions.
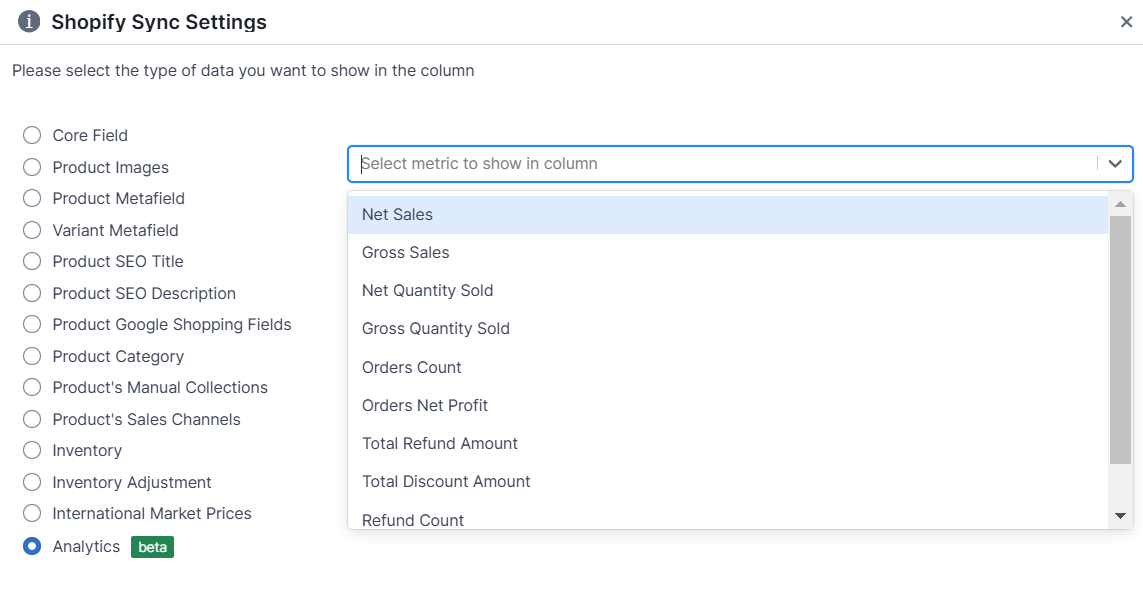
Integrating Net Sales alongside international prices and discount data allows for the calculation of critical metrics in Shopify, such as price elasticity, discount effectiveness, optimal price points, and market performance.
Here’s how to do it:
Note: To add Net Sales data to your International Prices spreadsheet, you need to install the Mixtable Analytics app.
Select the time range that you want the Net Sales to be calculated for. For example, with the Dynamic date range > last 30 days, you will get the net sales recalculated daily as the date range window moves forward.
In a similar way, you can pull additional analytics data in the worksheet, such as:
Operating in the Mixtable Spreadsheet Editor app allows you to use any spreadsheet function to analyze and manage your data, such as:
A: The easiest way to set Compare At price for different markets in Shopify is by using the International Prices spreadsheet template by Mixtable. Here’s what you need to do:
Find out more about the Mixtable suite of products here.