Shopify Sales for the Last Month
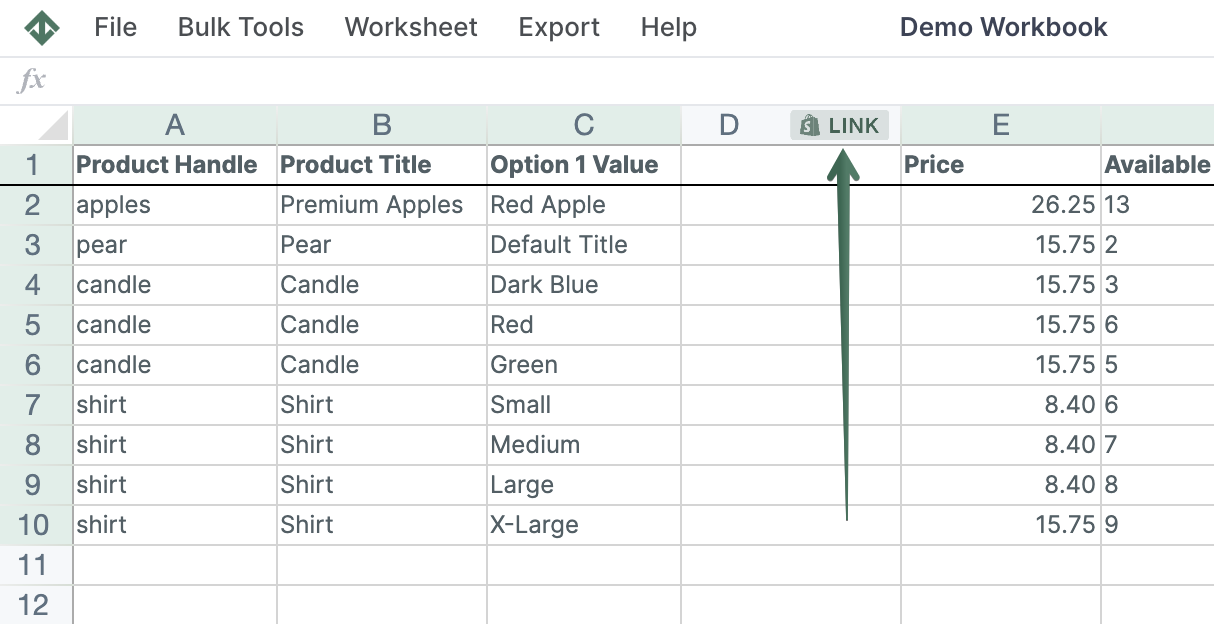
With Mixtable Analytics, you can see real-time updates on your sales data in an online spreadsheet. The Last Month metric shows the data from the first to the last day of the previous calendar month and is dynamically recalculated as the date range window moves forward.
How to add the Last Month of sales data to your worksheet
If you have already created a Mixtable workbook for your Shopify store, you can quickly add the sales data for the last month to a column in a worksheet.
- From the Shopify Sync Settings window, choose Analytics
- Then, select the metric, either Net Sales or Gross Sales.
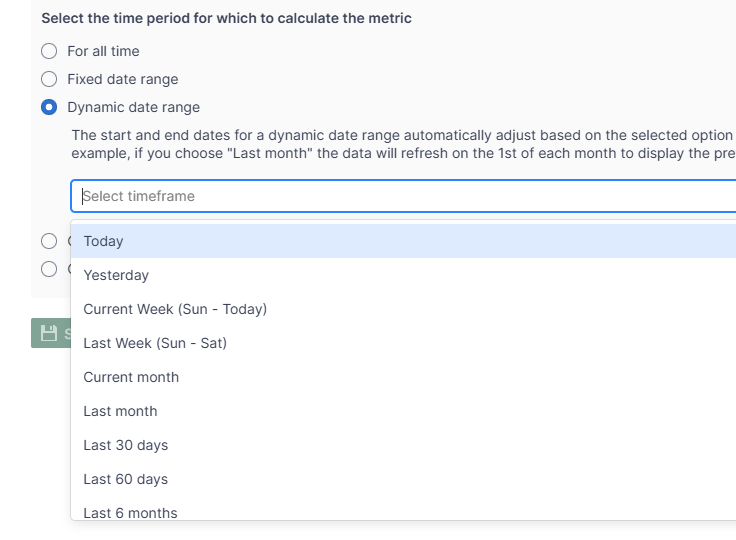
- From the section, Select the time period for which to calculate the metric, select Dynamic date range.
- Here, choose Last month. The metric shows the data for the first to last day of the previous calendar month and is dynamically recalculated as the date range window moves forward.
Optional - Last month of sales for a Customer Segment
Mixtable Analytics allows you to filter the sales data based on the customer segments you have created in Shopify.
- From the Shopify Sync Settings window, choose Analytics
- Then, select the metric, either Net Sales or Gross Sales.
- From the section, Select the time period for which to calculate the metric, and select Dynamic date range.
- Here, choose Last month. The metric shows the data for the first to last day of the previous calendar month and is dynamically recalculated as the date range window moves forward.
- Now, use the Filter orders based on Customer Segment defined in Shopify Admin section to select the customer segment to be used.
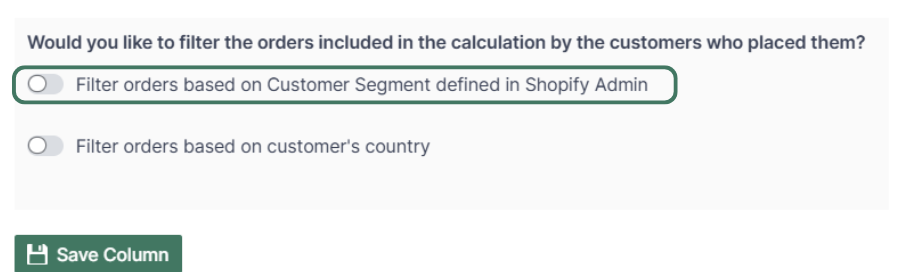
Note: The customer segments shown are the ones you have defined in your Shopify Admin. To add or change your segments please use the Shopify Admin, and Mixtable will reflect your changes automatically.
Optional - Last month of sales by Country
Another option for filtering the sales data is by the customer’s country. Use this feature to calculate your international store’s performance.
- From the Shopify Sync Settings window, choose Analytics
- Then, select the metric, either Net Sales or Gross Sales.
- From the section, Select the time period for which to calculate the metric, and select Dynamic date range.
- Here, choose Last month. The metric shows the data for the first to last day of the previous calendar month and is dynamically recalculated as the date range window moves forward.
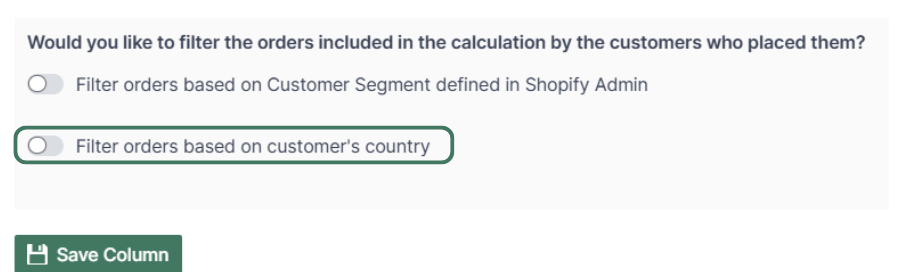
- Use the Filter orders based on customer’s country to select the country for which to show the data.
You are ready!
Well done! Now that you have the last month of sales data in an online spreadsheet for products or collections, you can use any spreadsheet function to analyze the data, such as:
Find out more about the Mixtable suite of products here.