Mixtable is an online spreadsheet, designed from the ground up to bulk edit and analyze Shopify data.
Got a question? We're here to help! Reach out at [email protected], and we'll get back
to you promptly.
Are you interested in tracking how many sales you generate from different countries in real-time? Or if there are countries with outlying numbers of refunds? Or if the discounts from a particular market lead to more orders? With Mixtable Analytics, you can now follow all this data from the comfort of a spreadsheet.
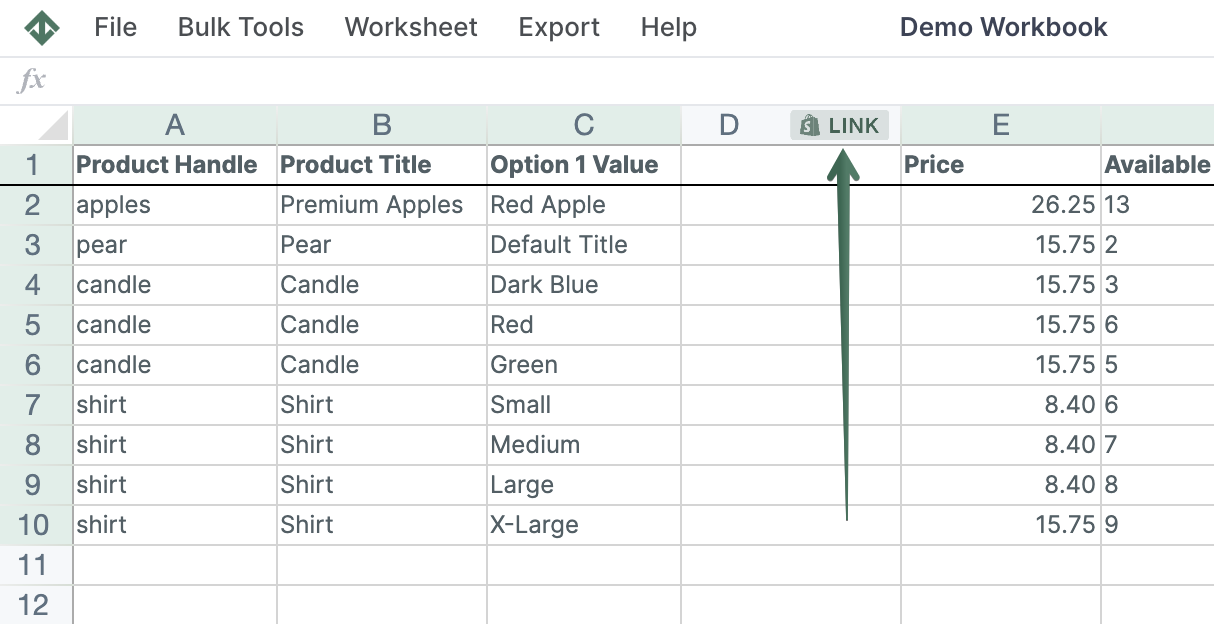
If you have already created a Mixtable workbook for your Shopify store, you can quickly add analytics data to an existing worksheet, such as:
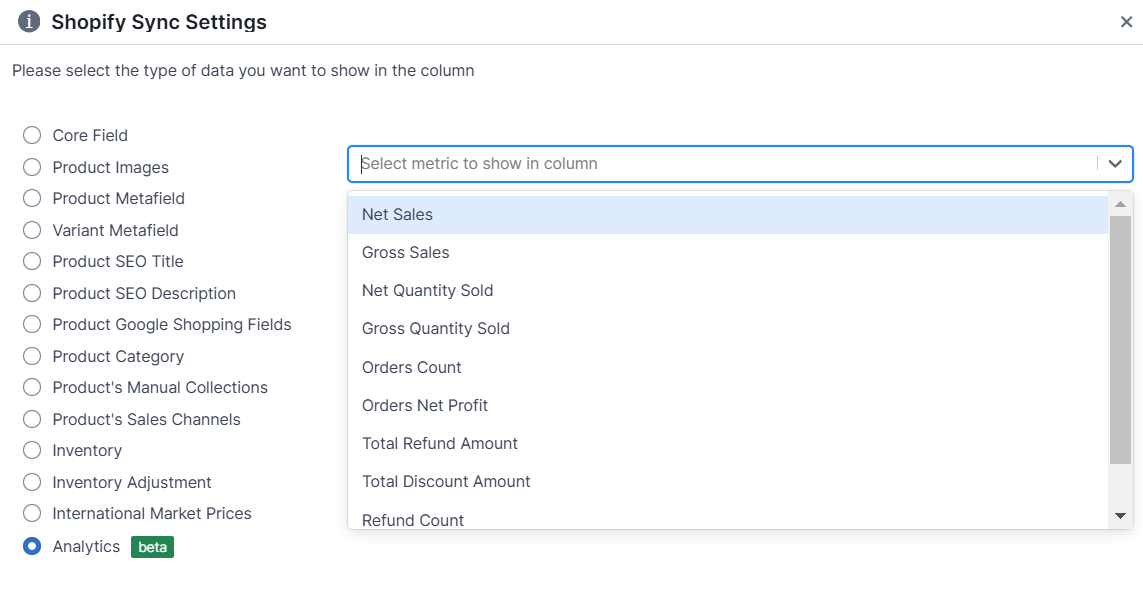
From the Shopify Sync Settings window, choose Analytics
Then, select the metric you want to see
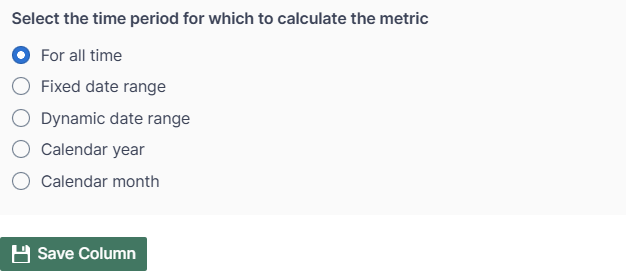
Select the time range that you want the data to be calculated for
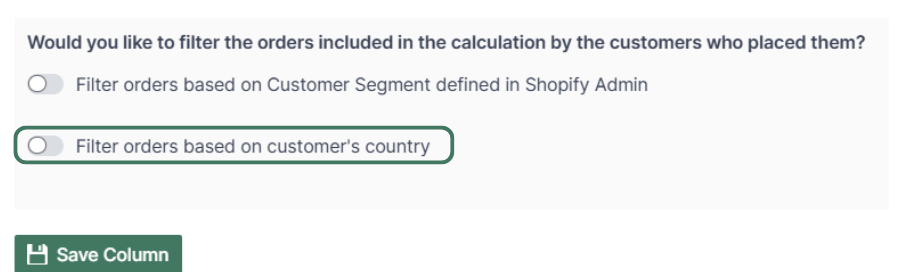
Use the Filter orders based on customer’s country to select the country for which to show the analytics metric:
Use the same Link option to add multiple columns. You can:
map sales data from different countries,
or add analytics data by customer country for:
With Mixtable you can use spreadsheet functions to operate with the data, such as: