Shopify Analytics for the Last 30 Days in a Spreadsheet App
Sales revenue is a key metric for every online store, and tracking it ensures staying up-to-date with its performance.
Having real-time Sales data in an online spreadsheet is very convenient. Here is how you can pull Net or Gross Sales data in a spreadsheet:
After installing the Mixtable Analytics app, click the Create a Workbook button.
Net/Gross Sales Dynamically for the last 30 days
- In the Blank workbook, click the (+) button from the bottom of the spreadsheet.
- Choose Shopify data worksheet > Products - Complete (with Variants).
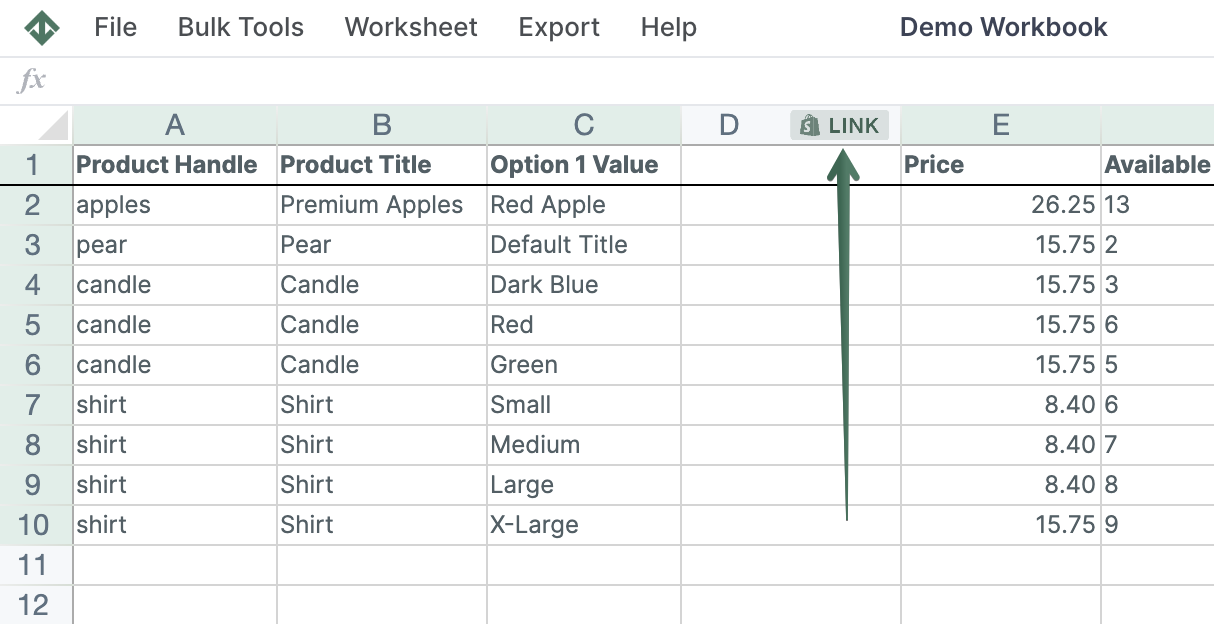
- In the new worksheet, choose an empty column and click the Link button from the column’s header.
- Select Analytics > Net or Gross Sales.
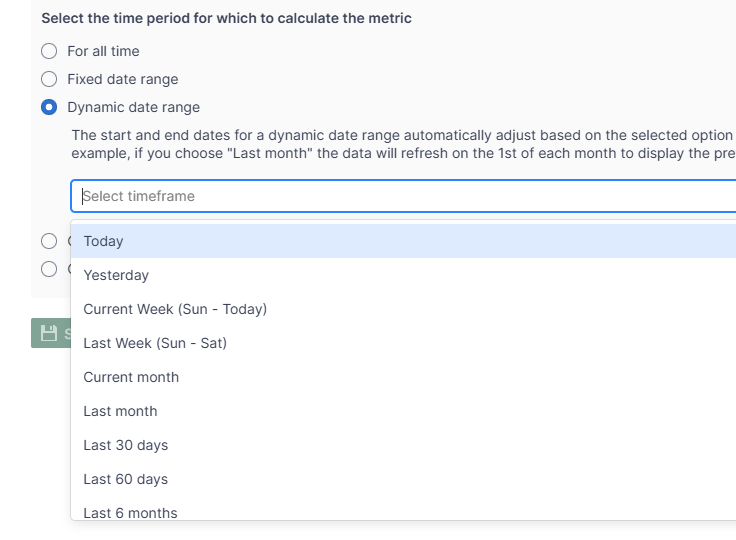
- From the Select the time period for which to calculate the metric, choose Dynamic Date Range > Last 30 Days.
Once you set up this column, it will be automatically updated with every new sale generated in your Shopify store — you won’t need to run reports each time you want to see the latest data.
Note: Mixtable Analytics has spreadsheet functionality, and you can use Excel formulas with the Last 30 days’ Sales metrics to calculate any KPIs you need.
Net/Gross Quantity Sold Dynamically for the last 30 days
- In the Blank workbook, click the (+) button from the bottom of the spreadsheet.
- Choose Shopify data worksheet > Products - Complete (with Variants)
- In the new worksheet, choose an empty column and click the Link button from the column’s header.
- Select Analytics > Net or Gross Quantity Sold.
- From the Select the time period for which to calculate the metric, choose Dynamic Date Range > Last 30 Days.
Once you set up this column, it will be automatically updated with every new sale generated in your Shopify store — you won’t need to run reports each time you want to see the latest data.
Orders Count Dynamically for the last 30 days
- In the Blank workbook, click the (+) button from the bottom of the spreadsheet.
- Choose Shopify data worksheet > Products - Complete (with Variants)
- In the new worksheet, choose an empty column and click the Link button from the column’s header.
- Select Analytics > Order Count.
- From the Select the time period for which to calculate the metric, choose Dynamic Date Range > Last 30 Days.
Once you set up this column, it will be automatically updated with every new sale generated in your Shopify store — you won’t need to run reports each time you want to see the latest data.
Refunds Analytics Dynamically for the last 30 days
- In the Blank workbook, click the (+) button from the bottom of the spreadsheet.
- Choose Shopify data worksheet > Products - Complete (with Variants)
- In the new worksheet, choose an empty column and click the Link button from the column’s header.
- Select Analytics > Total Refund Amount / Refund Count or Percentage of Orders Refunded
- From the Select the time period for which to calculate the metric, choose Dynamic Date Range > Last 30 Days.
Once you set up this column, it will be automatically updated with every new refund issued from your Shopify store — you won’t need to run reports each time you want to see the latest data.
Discounts Analytics Dynamically for the last 30 days
- In the Blank workbook, click the (+) button from the bottom of the spreadsheet.
- Choose Shopify data worksheet > Products - Complete (with Variants)
- In the new worksheet, choose an empty column and click the Link button from the column’s header.
- Select Analytics > Total Discount Amount.
- From the Select the time period for which to calculate the metric, choose Dynamic Date Range > Last 30 Days.
Once you set up this column, it will be automatically updated with every new sale with a discount generated in your Shopify store—you won’t need to run reports each time you want to see the latest data.