Mixtable is an online spreadsheet, designed from the ground up to bulk edit and analyze Shopify data.
Got a question? We're here to help! Reach out at [email protected], and we'll get back
to you promptly.
The inventory spreadsheet template from Mixtable allows you to track product availability, understand inventory distribution, and make data-driven decisions that can improve operational efficiency and customer satisfaction.
With one click, you can have inventory data directly into a spreadsheet. Here’s how to load the Inventory template:
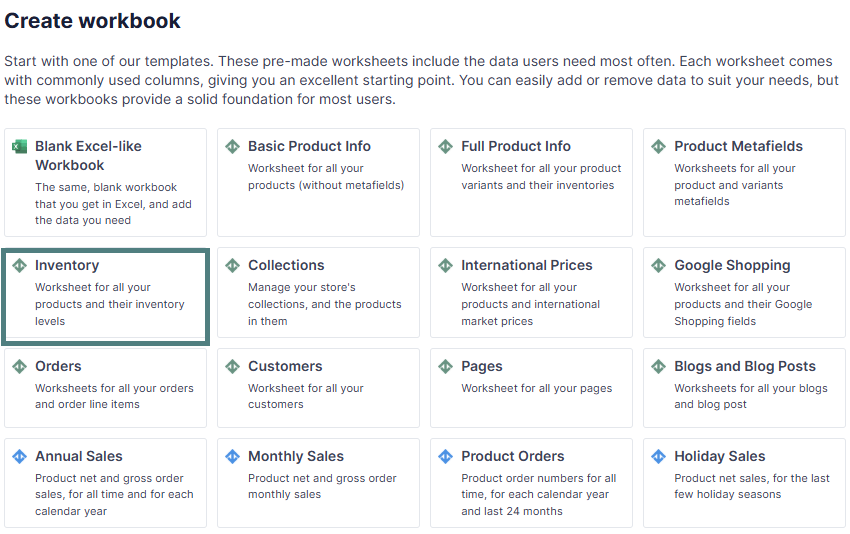
Here’s what you can use the Inventory template for:
Restock planning:
If the spreadsheet shows low stock for a best-selling product in multiple warehouses, it suggests an urgent need to restock or adjust stock allocation. (see below how to load the data)
Overstocked slow-moving products
If products have large inventory and minimal orders for the last month or so, you can initiate clearance promotions or discounts to move the excess inventory. (see below how to load the data)
Deadstock identification
If products have high stock levels across all warehouses but haven’t had any sales in the last three months, classify them as dead stock and take steps to reduce holding costs, such as bundling them with other items, offering deep discounts, or returning them to the supplier.
Discontinued product:
Products with consistently low or zero stock across all locations might indicate outdated or discontinued items, which need to be removed from the catalog.
Seasonal product patterns
Reduce stock levels during off-peak seasons and plan for seasonal stock increases closer to the holiday sale period to optimize space and minimize overstock costs.
Trending product
A sharp decline in the inventory of certain products over a short period (e.g., a week) may indicate a trend or seasonal demand spike. Plan to increase stock from suppliers or transfer stock from slower-moving locations to meet demand.
New warehouse
If you open a new warehouse and need to move inventory listing from one location to another.
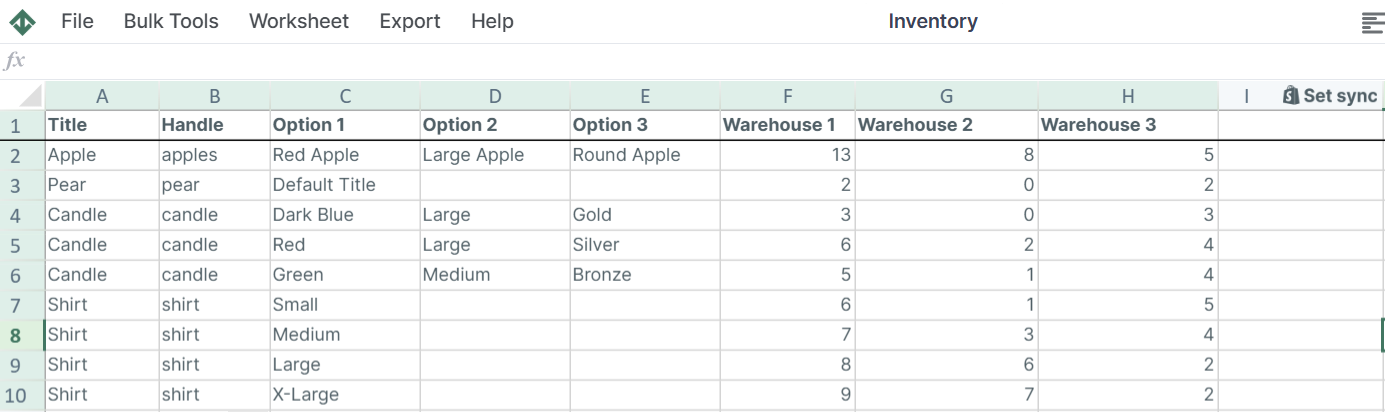
The Inventory template contains the following default columns:
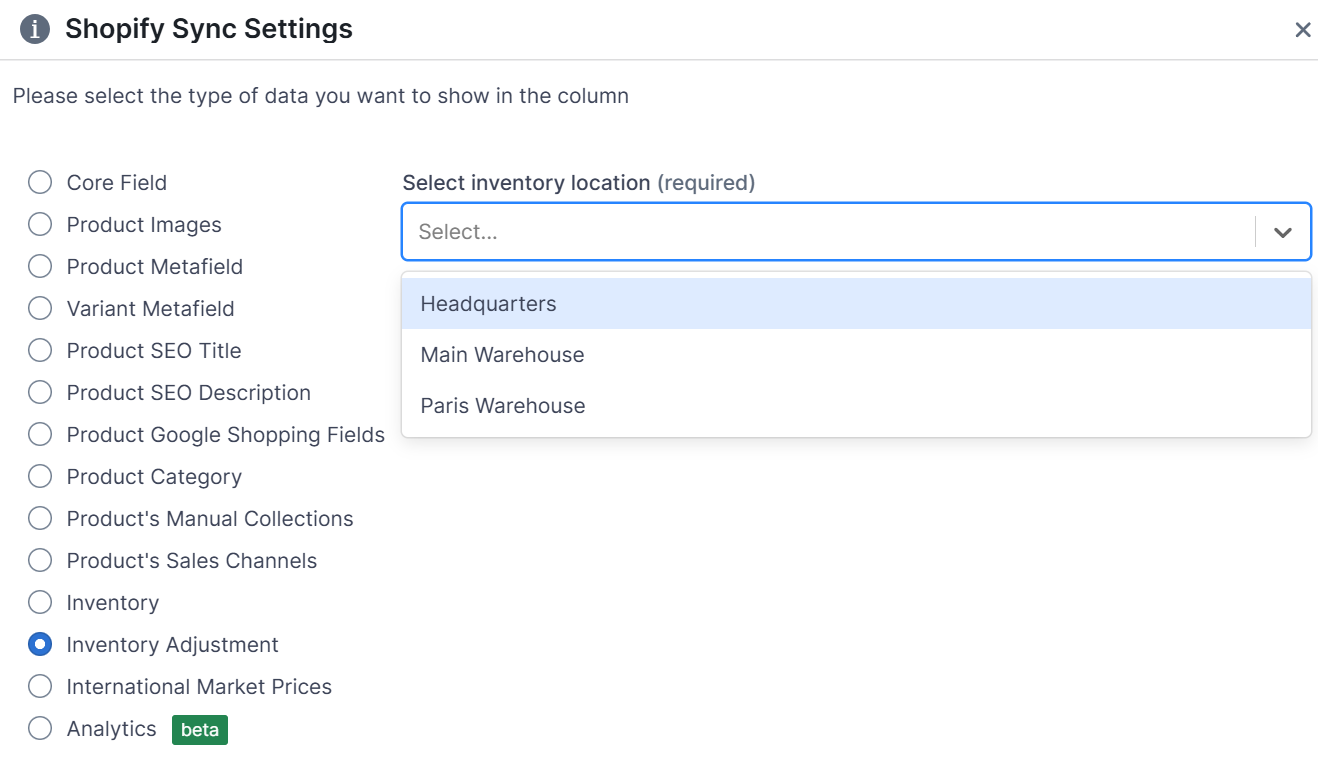
Inventory adjustments let you quickly increase or decrease stock at a location, avoiding incorrect values when multiple users or apps make changes. Add this column to your Inventory template to manage adjustments easily.
Here’s how to do it:
Operating in the Mixtable Spreadsheet Editor app allows you to use any spreadsheet function to analyze and manage your data, such as:
Here are some examples:
A: Yes! By default, the Inventory template loads all warehouse data and updates the product availability in real-time. Here’s how to see it:
Find out more about the Mixtable suite of products here.